Recent Developments on Resolution and Applicability of Capillary Hydrodynamic Fractionation (CHDF)
毛细管流体分离技术(CHDF)分辨率和应用的新的发展
J. Gabriel DosRamos,
Matec Applied Sciences, 56 Hudson St., Northborough, MA 01532 USA
Abstract:
摘要:
Capillary Hydrodynamic Fractionation (CHDF) is a high-resolution particle size distribution (PSD) analysis technique. CHDF is used to measure the PSD of colloids in the particle size range of 5 nm to 3 microns.
CHDF fractionation occurs as an eluant or carrier fluid carries the particles downstream in a capillary tube. Large particles exit the fractionation capillary ahead of smaller particles. Particle fractionation occurs because of the combination of the eluant parabolic velocity profile (laminar flow), size exclusion of the particles at the capillary wall, and colloidal forces.
The aim of this study was to expand CHDF’s applicability to a broader class of colloidal systems. This can widen CHDF’s usefulness as a particle sizing technique.
毛细管流体分离(CHDF)技术是一种高分辨的粒度分布(PSD)检测技术。毛细管流体分离技术(CHDF)用于测量粒径在5nm-3μm 范围内胶体的粒度分布(PSD)。
毛细管流体分离(CHDF)技术是以洗脱液或载体流体在毛细管中携带颗粒顺流而下的形式发生的。大颗粒先于小颗粒退出分离毛细管。颗粒分离是由于洗脱物抛物线速度剖面(层流)、在毛细管内颗粒的尺寸排斥和胶体力的共同作用而发生的。
本研究的目的是将毛细管流体分离(CHDF)应用于更广泛的胶体系统。这可以增加毛细管流体分离(CHDF)技术在粒度分析方面的应用。
Introduction:
介绍:
Particle sizing techniques can be grouped into High-Resolution (Fractionation) and Ensemble techniques (1). High-Resolution (HR) techniques are characterized by the fact that particles are fractionated according to size and/or mass during particle size analysis. Ensemble techniques perform measurements on all particles simultaneously without physical separation. HR particle size analyzers include Capillary Hydrodynamic Fractionation (CHDF), Field-Flow Fractionation, Single-Particle Counting, and Disc Centrifugation. Ensemble techniques include Laser Diffraction, Photon-Correlation Spectroscopy (PCS), acoustic-attenuation spectroscopy, and Turbidimetry. Electron Microscopy is in a class by itself as it offers high resolution but particles are not fractionated during analysis.
颗粒测量技术可分为高分辨(分离)技术和Ensemble粒度分析技术《1》。高分辨率技术的特点是因为在颗粒测量分析的过程中,粒子可以根据大小或者质量的不同而进行分离。Ensemble粒度分析技术在没有物理分离的情况下对所有粒子同时进行测量。高分辨的粒度分析技术包括毛细管流体分离(CHDF)、场流分离、单颗粒计数和圆盘离心组成。Ensemble粒度分析技术包括激光衍射、数字相关技术(PCS)、声衰减光谱和浊度测定方法等。电镜也属于高分辨粒径测量的技术,但是其并不能在分析的过程中将颗粒进行分离。
补充说明(内容来自网络):
1. 场流分离(Field flow fractionation—FFF)为适用于大分子、胶体和微粒的分离技术,使欲分离成分之流液流经上下平板构成扁平带状通道,并将一场垂直施加于通道。场将导致不同成分处在距下壁不同的位置上,移动速度因而不同,以达到分离的目的。 场流分离,可将“流”通过不对称场如电场,重力场,热场或半透膜。
该技术基本原理是大分子流过扁平通道,同时受到水平(channel flow)和垂直方向(cross flow)的流场作用;尺寸相对小的分子,受垂直方向的作用力较小,而向扁平通道ZX平移扩散;而尺寸相对较大的分子,受垂直方向的作用力较大而更靠近聚集壁(accumulated wall)。从而在垂直方向形成尺寸(size)梯度。而流体在扁平通道内,越靠近ZX,流速越快,而越靠近边缘,流速越均匀和越缓慢。因此,尺寸相对较小的组分先被后端检测器检测到;而较大尺寸的组分随后被检测。
2. Disc Centrifugation圆盘离心沉降法的原理是重力或者离心力使得悬浮在样品转盘腔内的颗粒可以产生沉降或离心运动。大颗粒运动较快,小颗粒运动较慢,随着时间的增加,大小颗粒自然分级并依次通过靠近转盘腔底内部的检测器,因而具有高的分辩率。
HR techniques offer a strong advantage in that they produce true particle size distribution (PSD) data. HR-based devices can in principle detect the presence of multiple particle size populations without making significant assumptions. On the other hand, HR devices tend to be more complicated to operate than ensemble instruments. Ensemble instruments produce mainly mean particle size and standard deviation data. Any mean particle size value can be produced by an infinite number of PSD curves. This ill-conditioned problem, along with the fact that calculated PSD’s vary significantly with minor noise in the raw data, force most ensemble devices to assume a priori the shape of the PSD (2). Despite these issues, ensemble devices are much more widely used than HR instruments. The two main reasons seem to be the following. Ensemble instruments are easier to use, and are more widely applicable to different types of dispersion/colloidal samples.
这种高分辨率的技术在真实的粒度分布(PSD)表征方面有非常明显的优势。一方面,基于这种高分辨率的技术可以用来分析多组分的复杂粒度体系,并不需要作出任何假设。但另一方面,这种高分辨率的技术设备运行往往相对统Ensemble粒度分析操作更复杂。Ensemble粒度分析技术可以提供平均粒径和标准偏差。任何平均粒径值都可以由无限条PSD曲线生成。这个原理的缺陷问题,会使得在只有少量噪声的情况下原始数据中计算出的PSD值变化很大,这迫使大多数Ensemble粒度分析设备需要预先假定PSD的形状《2》。尽管存在这些问题,Ensemble粒度分析设备比这种高分辨的技术应用往往更广泛。主要是有两个主要原因:Ensemble粒度分析设备更易于使用,更广泛地适用于不同类型的分散/胶体样品。
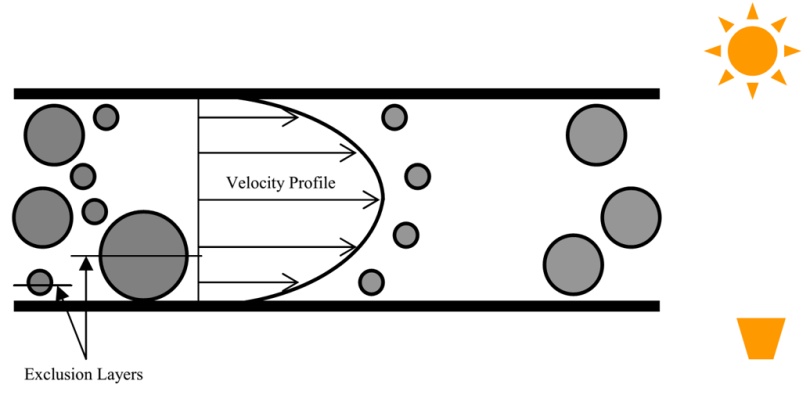
Figure 1- Particle size-based fractionation in CHDF.
图1. CHDF的颗粒分离示意图
Figure 1 describes the particle size-based fractionation process in CHDF. Larger particles exit the fractionation open capillary ahead of smaller ones (3). A UV detector is typically used as a particle-concentration detector. Such particle fractionation occurs because of a particle-size exclusion effect, plus colloidal forces affecting the particle motion. The latter consist mainly of particle/capillary electric double layer repulsion, and a lift force exerted by the moving fluid on the particles (4).
图1描述了毛细管流体分离(CHDF)技术中不同颗粒大小的分离过程的原理示意图。较大的颗粒比较小的颗粒先离开分离的毛细管《3》。一个紫外线探测器被用来检测粒子浓度。毛细管流体分离(CHDF)实现的粒子分离是由于粒子大小的排斥效应,加上影响粒子运动的胶体力。后者主要由颗粒电荷/毛细管电荷双电层斥力和运动的流体对微粒施加的升力组成《4》。
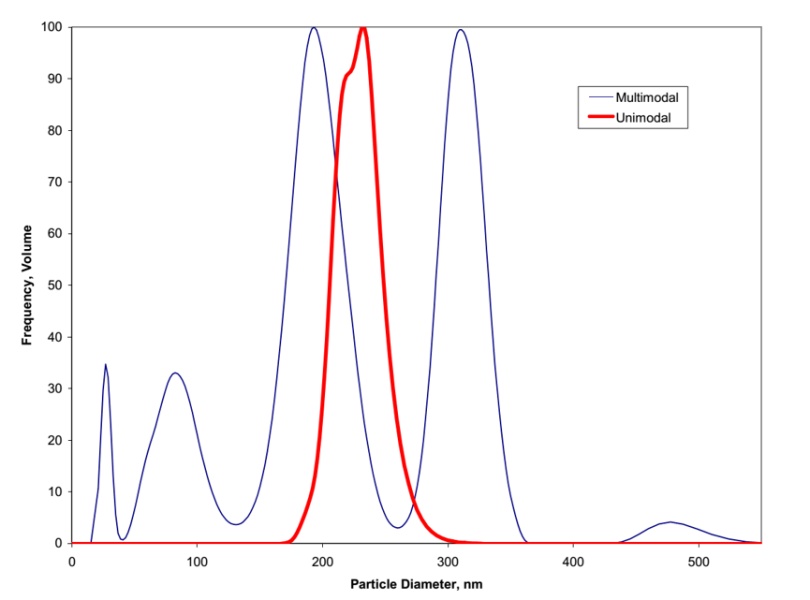
Figure 2. Two different samples analyzed by CHDF. Both have the same Volume-average (mean) particle size of 226 nm even though the PSD’s are different.
图2-两个不同的样品的CHDF测试数据.
两个样品相同的体积平均粒径但是PSD是不一样的。
Figure 2 shows CHDF2000 PSD data from two different polystyrene samples with the same volume-average mean particle size value of 226 nm even though their PSD’s are noticeably different. This data exemplifies the risks of relying exclusively on mean particle size data. These samples will behave differently despite their identical mean particle size.
图2显示了两种不同的聚苯乙烯样品的CHDF2000 PSD测试数据,即使他们具有相同的体积平均粒径值226 nm,但是它们的PSD值有明显的不同。这些数据说明了完全依赖平均粒径数据的风险。尽管这些样品的平均粒径相同,但它们的PSD分布却不同。
It is in principle possible for a sample with a 226 nm mean particle size not to contain any 226 nm particles. This constitutes another disadvantage of relying on mean particle size data alone.
对于平均粒径为226 nm的样品,实际上却可以并不包含任何226 nm的颗粒。这构成了仅依赖平均粒径数据的另一个缺点。
This paper describes efforts to expand the applicability of CHDF to different types of dispersed systems, including expanding its particle size analysis range. Also, a process on-line CHDF setup with automated sample dilution is presented.
本文描述了毛细管流体分馏(CHDF)技术在不同类型的分散系统中的适用性,包括扩大其粒度分析范围。同时,提出了一种自动稀释样品的毛细管流体分离(CHDF)在线检测方法。
Experimental:
实验部分:
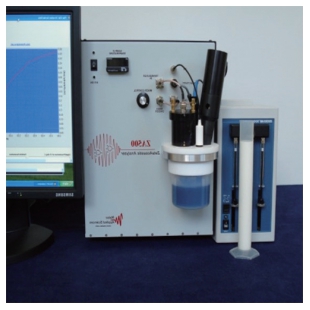
CHDF measurements were performed using a commercial CHDF2000 high resolution particle size analyzer from Mass Applied Sciences, Northborough, MA (5). Various colloidal samples were used. Polystyrene samples were obtained from Duke Scientific (Indianapolis, IN), and Seradyn (Indianapolis,
IN).
高分辨率的毛细管流体分离(CHDF)粒度测量技术,是由位于美国-马萨诸塞州Mass Applied Science(MAS)公司研发和生产的《5》。并测试了不同的胶体样品。聚苯乙烯粒子样品来自于Duke和Seradyn (Indianapolis, IN)。
Nanoparticle Size Analysis:
纳米颗粒大小分析:
Small particles, especially under 50 nm, are becoming more widely manufactured and employed in various intermediate and final colloidal products. Accurate particle size analysis of these small particles is essential. Small particles offer a large total surface area. Secondary smaller particle size populations can be unexpectedly present in any dispersion. Such smaller particles can sharply influence the performance of any dispersion. Additionally, a small number of larger particles can posse difficulties, e.g., larger particles in inkjet printing inks can plug ink conduits in today’s inkjet printers.
小颗粒,特别是50nm以下的小颗粒,正在越来越广泛地被制造和应用于各种胶体的中间和Z终产品中。准确分析这些小颗粒的粒径是至关重要的。小颗粒提供了很大的总表面积。在任何分散体中都可能出现次级较小粒径的粒子群。如此小的粒子可以极大地影响任何分散体系的性能。此外,少数较大的颗粒会造成困难,例如,在喷墨打印机中较大的颗粒会堵塞墨道。
Particle sizing of nanoparticles is difficult for most particle sizing techniques. Because of refractive index issues, as well as the fact that larger particles mask smaller particles, ensemble-type measurements such as Laser Diffraction and Photon Correlation Spectroscopy (PCS) have difficulty analyzing such nanoparticles. High-resolution devices such as disc centrifuges are also limited due to the lack of tendency of nanoparticles to sediment, even under strong centrifugal fields.
纳米粒子的粒径测定是目前大多数粒径测定技术的难点。由于折射率问题,以及大颗粒掩盖小颗粒的事实,像激光衍射和光子相关光谱(PCS)等Ensemble粒度分析技术很难分析这样的纳米颗粒。像圆盘离心机这样的高分辨率设备也会受到此限制,因为即使在强离心场下,纳米粒子也不易沉积。
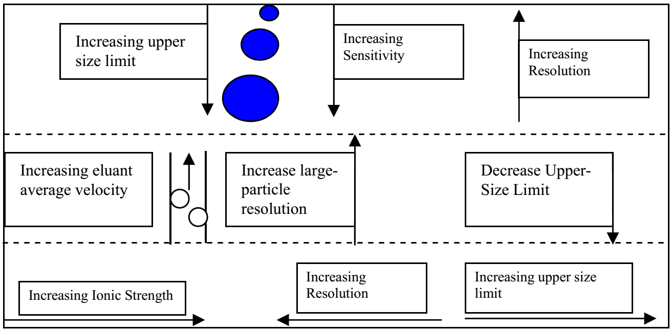
Figure 3. Effects of capillary inner diameter and eluant ionic strength and average velocity on CHDF resolution and particle size fractionation range.
图三-毛细管内径、淋洗液离子强度和平均流速对
毛细管流体分离(CHDF)分辨率和粒度分离范围的影响。
Fig. 3 illustrates the effects of capillary ID, eluant average velocity, and eluant ionic strength on the resolution and particle-size fractionation range. As the capillary ID increases, so does the sample volume in the capillary. This increase in sample volume is due to the fact that the waste/fractionation split ratio changes (6), i.e. more sample flows into the fractionation capillary relative to the “waste” stream. Such increase in fractionated-sample volume results in stronger particle detection in the CHDF particle-concentration detector, usually a UV detector.
图3描述了毛细管内径、洗脱液平均流速、洗脱液离子强度对颗粒分离范围和分辨率的影响。随着毛细管内径的增加,毛细管中的样品体积也随之增加。样品体积的增加是由于废废液/分离样品分流比的变化《6》,相对于废液流,更多的样品流入分馏毛细管。分馏样品体积的增加使得毛细管流体分离(CHDF)颗粒浓度检测器(通常是UV检测器)的颗粒检测能力增强。
Conversely, fractionation resolution increases as the capillary ID is reduced (7). This is due to several compounding factors as follows: (i) the particle exclusion layer is larger relative to the capillary ID, (ii) the lift force is stronger, and (iii) the particle fractograms are narrower due to lower axial dispersion.
相反,随着毛细管内径的减少,分离的分辨率增加《7》。这主要是由以下几个复合因素造成的:(i)颗粒排斥层相对于毛细管内径较大;(ii)升力较强;(iii)由于轴向弥散较低,颗粒断口较窄。
The upper particle size limit decreases with decreasing capillary ID. Physically, larger particles can flow in a larger-ID fractionation capillary; also, the lift force is lower for larger-ID capillaries; this allows fractionation among larger particles.
粒径上限随毛细管内径的减小而减小。物理上,较大的颗粒可以在较大的内径分馏毛细管中流动;同样,对于较大的内径毛细管,提升力较低,可以用来进行较大的颗粒的分离。
The eluant average velocity also plays a role on the resolution and particle size range. As the eluant average velocity in increased, large-particle size fractograms become narrower. This Fractogram narrowing is due to the increase in lift force strength which forces larger particles to travel closer together. As the lift force increases, the upper particle size fractionation limit decreases similarly to reducing the capillary ID (8).
淋洗液平均流速也对其分辨率和粒径检测范围也有影响。随着洗脱液平均流速的增加,大颗粒尺寸的断口变得越来越窄。这种断口变窄是由于提升力强度的增加,从而迫使较大的颗粒更接近地一起移动。随着升力的增大,颗粒粒度的分离上限减小,与减小毛细管内径值结果相似《8》。
Suitable capillary ID and length, plus the eluant ionic strength and mean velocity can be combined to produce high resolution PSD data as shown in figures 4 and 5. Data is shown for the fractionation of eight particle size populations in less than 10 minutes.
合适的毛细管内径和长度,加上合适的洗脱液离子强度和平均速度,可以组合起来得到高分辨率的PSD数据,如图4和5所示。数据显示了在不到10分钟内对8个粒径粒子的分离。
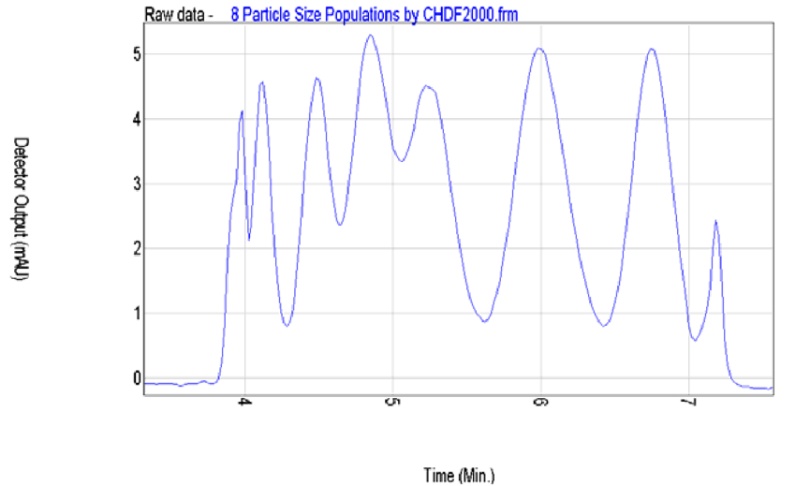
Figure 4. CHDF fractionation UV-detector raw data for a blend of 8 polystyrene calibration standards.
图4-CHDF-UV检测器对8种混合聚苯乙烯标准粒子的原始测试数据

Figure 5. CHDF PSD data for an 8-mode polystyrene blend.
图5-8种聚苯乙烯共混物的CHDF PSD数据。
This blend is composed of (from left to right on the raw-data graph) 800, 605, 420, 310, 240, 150, 60, and 20 nm. The peak separation on the raw data graph can be enhanced further by simply lengthening the fractionation time. The raw data peaks appear more overlapped than on the PSD. The reason is that a deconvolution procedure has been applied in the PSD computations (9). The deconvolution computations are similar to those used in Gel Permeation Chromatography for incorporating into the PSD computations axial dispersion of particles during capillary flow. Axial dispersion broadens the Fractogram width.
这种混合物由800、605、420、310、240、150、60和20nm组成(从原始数据图的左到右)。通过简单地延长分离时间,可以进一步增强原始数据图上的峰分离。原始数据峰值看起来比PSD上的重叠更多。其原因是在PSD计算中应用了反卷积方法《9》。反卷积计算类似于凝胶渗透色谱法,用于将毛细管流动过程中颗粒的轴向弥散纳入PSD计算。轴向弥散使裂缝宽度变宽。
补充说明(内容来自网络):
1. Deconvolution反卷积算法:
在数学中,反卷积是一种基于算法的过程,用于反转卷积对记录数据的影响。 反卷积的概念广泛用于信号处理和图像处理技术。 由于这些技术反过来在许多科学和工程学科中广泛使用,因此反卷积可以应用到许多领域。反卷积是信号处理中一类基本问题,广泛应用于信道均衡、图像恢复、语音识别、地震学、无损探伤等领域,也可应用于未知输入估计和故障辨识问题。
褶积(又名卷积)和反褶积(又名去卷积)是一种积分变换的数学方法,在许多方面得到了广泛应用。在泛函分析中,卷积、旋积或摺积(英语:Convolution)是通过两个函数f 和g 生成第三个函数的一种数学算子,表征函数f 与g经过翻转和平移的重叠部分函数值乘积对重叠长度的积分。
2. Gel Permeation Chromatography凝胶渗透色谱法:
凝胶渗透色谱(Gel Permeation Chromatography、GPC)是1964年,由J.C.Moore首先研究成功。不仅可用于小分子物质的分离和鉴定,而且可以用来分析化学性质相同分子体积不同的高分子同系物。(聚合物在分离柱上按分子流体力学体积大小被分离开)。
CHDF offers a useful alternative for nanoparticle analysis due to the fact that larger particles do not mask the presence of small particles, as well as, nanoparticle analysis is as easy and accurate as for larger particles. However, CHDF also faces difficulties in analyzing particles smaller than 20 nm. These particles are difficult to quantify in the presence of larger particles due to large differences in UV-light extinction cross section (10). These difficulties are shown in the well-known Beer-Lambert’s law equation as follows:
D.O. = N Rext χ [1]
Where D.O. is the UV-detector output, N is the number of particles per unit volume, Rext is the particle extinction cross section, and χ is the UV-detector flow-cell path length. Equation [1] allows the calculation of N for each individual slice of particles exiting the CHDF fractionation capillary. N computations are susceptible to minor noise in D.O. when a sample contains particles under 20 nm along with larger particles, e.g. particles over 500 nm.
由于大颗粒不会掩盖小颗粒的存在,毛细管流体分离(CHDF)为纳米颗粒分析提供了一种有用的替代方法,让纳米颗粒分析与大颗粒分析一样简单和准确。然而,CHDF在分析小于20nm的颗粒时也会面困难。由于紫外消光截面的巨大差异,这些粒子在较大粒子存在时很难量化《10》。这些困难显示在的比尔-朗伯定律方程如下:
D.O. = N Rext χ [1]
这里D.O.是紫外线探测器输出,N是单位体积的粒子数,Rext是粒子消光界面,χ是紫外检测器流动池路径长度。方程允许计算出毛细管流体分离(CHDF)细管中每一片颗粒的N。当样品含有小于20nm的粒子和较大的粒子(例如大于500nm的粒子)时, N的计算容易D.O.中微小噪声的影响。
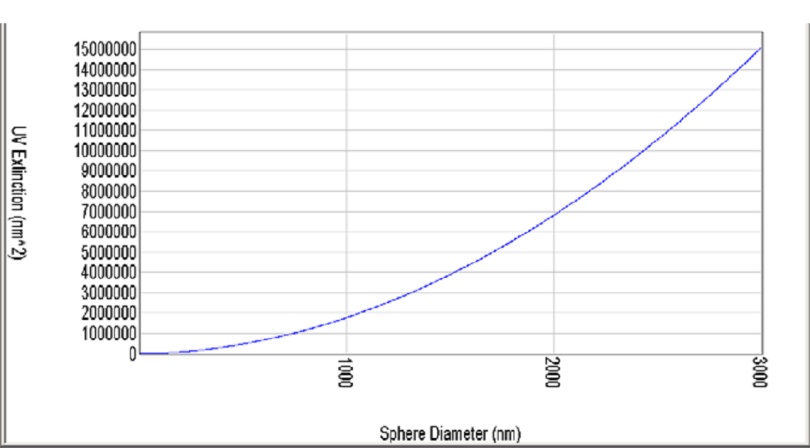
Figure 6. Extinction cross section for polystyrene particles in water. Curve generated from Mie theory computations.
图6-由Mie理论计算得到的聚苯乙烯颗粒在水中的消光截面。
Figure 6 shows an extinction cross section curve for polystyrene particles in water. This curve was generated from Mie-theory computations built into the operating software on the commercial CHDF2000 device.
图6显示了聚苯乙烯颗粒在水中的消光截面曲线。此曲线是CHDF2000设备上的操作软件中,内置的Mie理论计算生成的。
Figure 6 shows that there are several orders of magnitude between the Rext of particles smaller than 20 nm and those larger than 500 nm. Consequently, small D.O. errors become largely amplified in the computation of N.
从图6可以看出,小于20nm和大于500nm的颗粒之间存在几个数量级的Rext。因此,微小的D.O.误差在N的计算中被极大地放大。
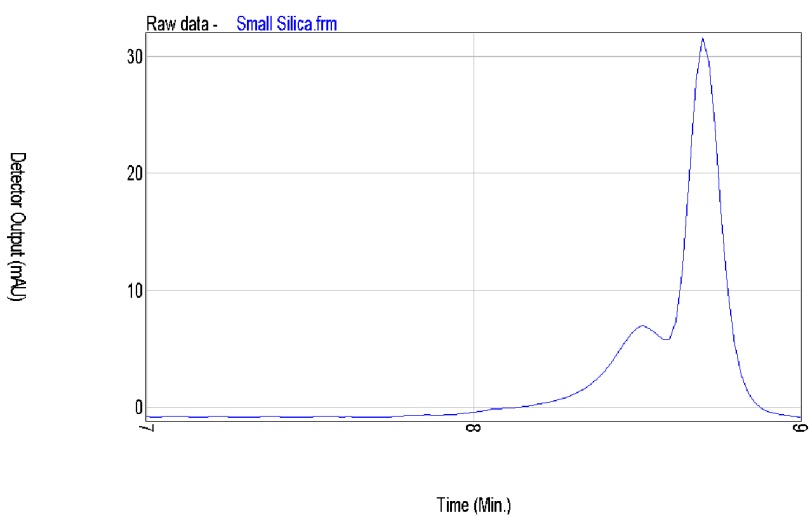
Figure 7. CHDF UV-detector raw data output for a 5-nm nominal particle size silica.
图7- CHDF紫外检测器得到的5nm二氧化硅粒子的原始输出数据。
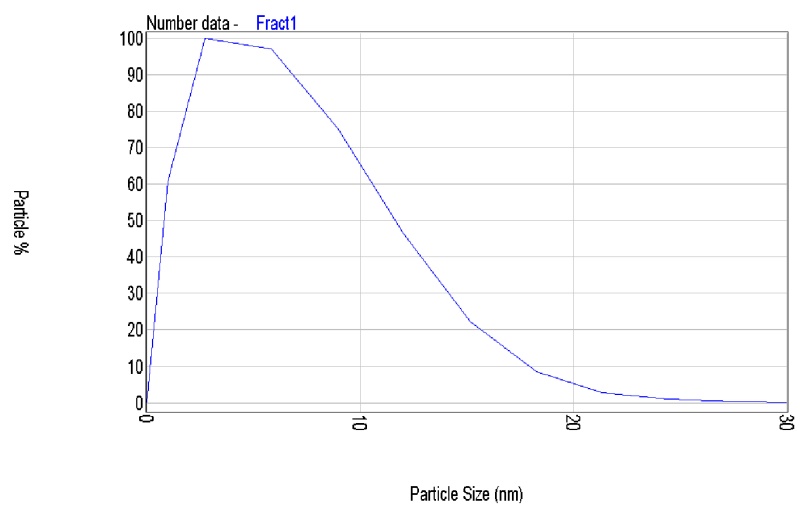
Figure 8. CHDF PSD for a 5-nm nominal particle size silica sample.
图8- CHDF得到的5nm二氧化硅粒子的粒度分布图。
Despite the challenges described above, the CHDF2000 device was able to accurately perform particle sizing measurements of silica particles under 20 nm as shown in Figures 7 and 8.
尽管存在上述挑战,美国MAS的CHDF2000设备仍能够准确地对20nm以下的二氧化硅颗粒进行准确的粒度分析,如图7和8所示。
The accurate measurement of these small particles was achieved by maximizing resolution and particle-detection sensitivity. This required optimizing the combination of suitable capillary diameter and length, and eluant ionic strength and average velocity.
美国MASS生产研发CHDF系列设备通过优化合适的毛细管直径和长度、洗脱液离子强度和平均流速的组合,让设备的分辨率和粒子检测灵敏度达到很大化,实现了对这些小粒子的极ng确测量。
The CHDF raw data in figure 7 shows two main peaks located at 8.5 and 8.7 minutes. The peak at 8.7 minutes is believed to originate from UV-absorbing molecules in the sample such as surfactants, electrolytes, and acid or base molecules (11). These molecules exit the capillary last because their particle size is smaller than that of the silica particles. The molecular peak does not appear in the PSD graph of figure 8 because its particle size is below the low computational limit of 1 nm.
从图7的原始数据可以看出,在8.5和8.7分钟出有两个主要的峰。8.7分钟时的峰值被认为是来自样品中的紫外线吸收分子,如表面活性剂、电解质、酸或碱分子《11》。这些分子Z后离开毛细管是因为它们的粒径小于二氧化硅颗粒。分子峰不出现在图8的PSD图中,因为其粒径低于1nm的计算下限。
Figure 8 presents the PSD for this silica sample. A lognormal PSD shape is obtained ranging from 1 nm to 30 nm. The mode is located at 4 nm.
图8显示了这个二氧化硅样品的PSD分布。得到了1~30nm的对数正态PSD形状。PSD的峰值位于4nm处。
In order to achieve the maximum resolution required for these small particles (7) a low ionic strength (0.1 mM) carrier fluid was used in conjunction with a 5-micron ID fused silica capillary.
为了获得检测这些小颗粒所需的Zda分辨率《7》,低离子强度(0.1 mM)载体流体与5μm管径熔融石英毛细管一起使用。
CHDF Particle Size Analysis of Micron-Sized Particles:
CHDF技术分析微米级颗粒:
CHDF has been commonly used for analysis of particles below 1 micron in size. As mentioned above, larger particles are typically subject to a “Lift Force” in the fractionation capillary. The lift force pushes larger particles toward the center of the capillary. The Lift force is proportional to the ratio of particle to capillary radii, and to the eluant average velocity. Thus, lowering the eluant average velocity along with using larger-ID fractionation capillaries reduce the lift force and extend the CHDF particle size upper limit.
毛细管流体分离(CHDF)通常用于分析1μm以下的颗粒。如前所述,较大的颗粒在分离毛细管中通常受到升力的作用。升力将较大的颗粒推向毛细管的ZX。升力与颗粒毛细管半径之比及洗脱液平均速度成正比。因此,降低洗脱液平均流速,同时使用大粒径分离毛细管,可以降低升力,提高CHDF粒径检测上限。

Figure 9. CHDF UV-detector raw data output for a blend of 5μm, 1μm, and 0.1μm polystyrene latex standards. Sodium benzoate “marker” is injected about 1 minute after the blend.
图9- 5,1, 0.1μm三种混合体系的CHDF UV检测器原始数据图。
苯甲酸钠“标记物”在混合后约1分钟注射。
Fig. 9 shows CHDF UV-detector vs. time fractionation data for a blend of 5, 1, and 0.1-micron polystyrene standards. The marker is injected about one minute after the blend. This data shows that CHDF fractionation is indeed able to fractionate particles larger than one micron. However, it is desirable to increase the fractionation resolution further in order to enhance particle size analysis capability for these larger particles. Further work is in progress.
图9显示了5μm、1μm和0.1μm聚苯乙烯标准混合物的CHDF UV检测器输出数据与时间关系的原始数据。苯甲酸钠“标记物”大约在混合后一分钟注射。这些数据表明,毛细管流体分离(CHDF)技术确实能够分馏大于1μm的颗粒。然而,为了提高这些较大颗粒的粒度分析能力,我们希望进一步提高分馏分辨率。进一步的工作正在进行中。
On-Line Development
在线扩展
Today, there is a lack of (process) in-line, at-line, or on-line particle size analyzers suitable for analysis of liquid dispersions. Process particle sizers can become a vital component of slurry / dispersion / latex / emulsion production. Such analyzers can provide labor savings, as well as ensure product quality. Process particle sizers must be highly accurate, reproducible, precise, and reliable (12).
目前,还缺乏适合分析液体分散的在位,近线或在线的粒度分析仪。工艺检测的粒度仪可以成为泥浆/分散液/乳胶/乳液生产的重要组成部分。这样的粒度分析仪可以节省劳动力,同时保证产品质量。在线工艺粒度仪必须高度极ng确、可重复、极ng确和可靠《12》。
补充说明(内容来自网络):
1. in-line/at-line/on-line的区别:
in line 可对应为在线,样品在生产线上,检测装置也在生产线上,样品检测不影响工艺流;on line可对应为随线,检测装置在生产线上,样品从生产线的工艺流中转到检测装置中完成检验;at line可对应近线,首先样品肯定是离线的,从生产线取出,在靠近生产线的地方检测。
2014年2月份欧盟出的工艺指南中对这三个词的定义如下:
At line: Measurement where the sample is removed, isolated from, and analyzed in close proximity to the process stream. At line 样品从工艺流中移除、隔开,并且在靠近工艺流的地方分析的检测。
On line: Measurement where the sample is diverted from the manufacturing process and not returned to the process stream. On line 检测样品从生产工艺中转移出来并不返回工艺流中。
In line: Measurement where the sample is analyzed within the process stream and not removed from it. In line 样品在工艺流中进行检测并不从中移除。
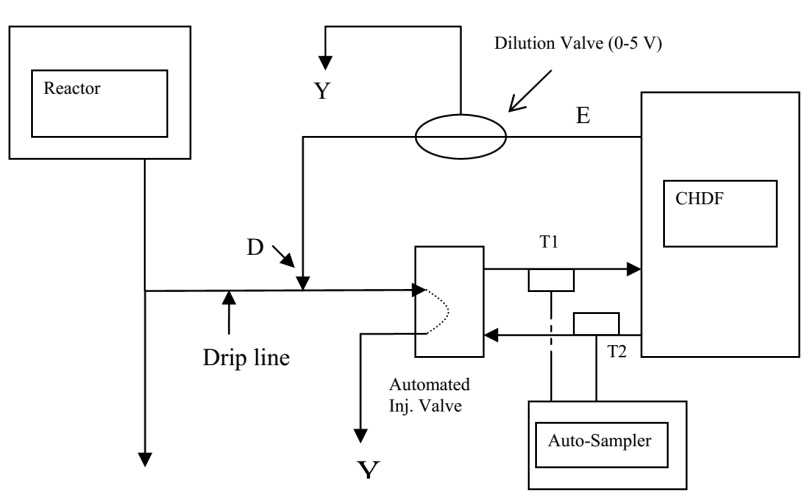
Figure 10. On-line CHDF setup equipped with sample auto-dilution.
图10。CHDF配备样品自动稀释的在线设置。
Fig. 10 shows a schematic diagram of an on-line CHDF device. The CHDF2000 unit used here is identical to the off-line device available commercially (Matec Applied Sciences, Northborough, MA). With the off-line device, samples are injected into the fractionation capillary using either an on-board manual HPLC type injection valve or an HPLC auto-sampler. In the on-line setup, the sample flows directly from the process into an automated injection valve. The automated injection valve is actuated by the CHDF2000 on-line software in order to make sample injections every 5-10 minutes.
图10为在线CHDF装置的原理图。这里使用的组件单元与美国MAS市售的脱机设备CHDF2000完全相同(Mass Applied Sciences, 马萨诸塞州, MA)。通过脱机装置,样品可通过车载手动GX液相色谱注射阀或GX液相色谱自动进样器注入分馏毛细管。在在线设置中,样品直接从产线流向一个自动注入阀。自动进样阀由CHDF2000在线软件驱动,每5-10分钟进样一次。
This particular arrangement has been used with a batch-polymerization reactor. This on-line device can also be used with continuous or semi-continuous reactors, as well as steady-state slurry streams.
这种特殊的排列方式已用于分批聚合反应器。该在线装置也可用于连续或半连续反应器,以及稳态泥浆流的反应监测。
The percent solids level of a batch polymerization reactor starts at zero and increases with time (13). The on-line CHDF setup must be able to handle this constant increase (CHDF analysis is typically performed in the weight-percent solids range of 0.1 to 5%). The analysis process is as follows:
间歇式聚合反应器的固体含量从零开始随时间逐渐增加《13》。在线CHDF软件设置必须能够处理这种恒定的增加(CHDF分析通常在重量-固体百分比0.1到5%的范围内执行)。分析过程如下:
A “drip” line connected to the reactor system takes a steady stream of sample through the remotely-actuated (HPLC) injection valve. The sample is diluted as needed at point D. The injection valve automatically takes samples from the drip line and performs sample injections into the CHDF fractionation capillary every few minutes. CHDF eluant continuously flows through the injection valve in order to carry the samples into the fractionation capillary. The dilution valve sets the diluent vent (Y)/dilution (D) split ratio.
连接到反应器系统的“滴水”管线通过远程驱动(HPLC)注射阀获取稳定的样品流。样品按需要在D点稀释。注入阀自动从滴管中抽取样品,每隔几分钟将样品注入CHDF分离毛细管。CHDF洗脱液通过注入阀连续流动,将样品带入分离毛细管。稀释阀设置稀释液排出(Y)/ 稀释液(D)分流比。
In order to eliminate the need for a diluent pump, the effluent (E) from the CHDF is used as diluent. E is split at the dilution valve into a vented (Y), and a diluent (DFR) portion.
为了消除稀释泵的需要,CHDF的流出物(E)被用作稀释剂。E在稀释阀处分成一个排出(Y)和一个稀释剂(DFR)部分。
Valves T1 and T2 allow the use of an HPLC auto-sampler for calibration standard analysis. The operator can thus perform periodic performance tests of the on-line CHDF setup.
阀门T1和T2允许使用GX液相色谱自动采样器进行校准标准分析。因此,操作员可以对联机CHDF设置执行定期性能测试。
The CHDF software calculates the area under each Fractogram. The dilution level is calculated by comparing the current Fractogram area to a pre-established suitable area value as follows:
DFR = C*PA/FA [2]
CHDF软件计算每个分形图下的面积。稀释水平的计算方法是将当前的分形图面积与预先设定的适当面积值进行比较,如下所示:
DFR = C*PA/FA [2]
Where DFR is the diluent flow rate, C is a constant, PA is the pre-established (acceptable) Fractogram area, and FA is the sample fractogram area. DFR is set by sending a 0-5 volt signal to the dilution valve. As DFR increases, the vented (Y) eluant flow rate decreases.
其中DFR为稀释剂流量,C为常数,PA为预先设定的(可接受的)分形图面积,FA为样品分形图面积。DFR是通过向稀释阀发送0-5伏信号来设置的。随着DFR的增大,流出(Y)淋洗液流量减小。
PSD data files are saved to a network location. A Honeywell PlantScape process control system reads the PSD data and performs process control steps such as valve opening/closing and reactor temperature adjustment.
PSD数据文件保存到网络位置。霍尼韦尔PlantScape过程控制系统读取PSD数据并执行过程控制步骤,如阀门打开/关闭和反应堆温度调节。
Figures 11 and 12 show polyvinyl acetate CHDF data collected from an on-line device connected to a batch reactor.
图11和图12显示了从连接到间歇式反应器的在线设备上收集到的聚醋酸乙烯CHDF数据。
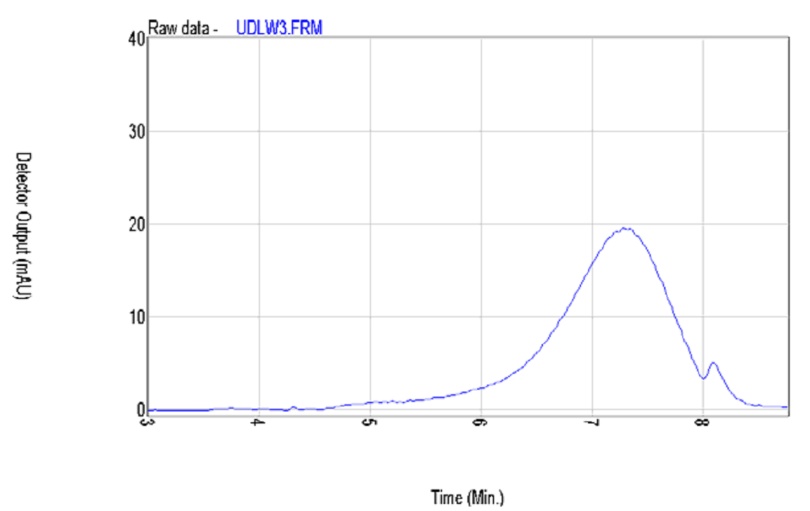
Figure 11. On-line CHDF UV-detector output for a PVA latex from a batch reactor.
图11-聚乙烯醇乳胶在一批反应器在线CHDF紫外检测器输出数据
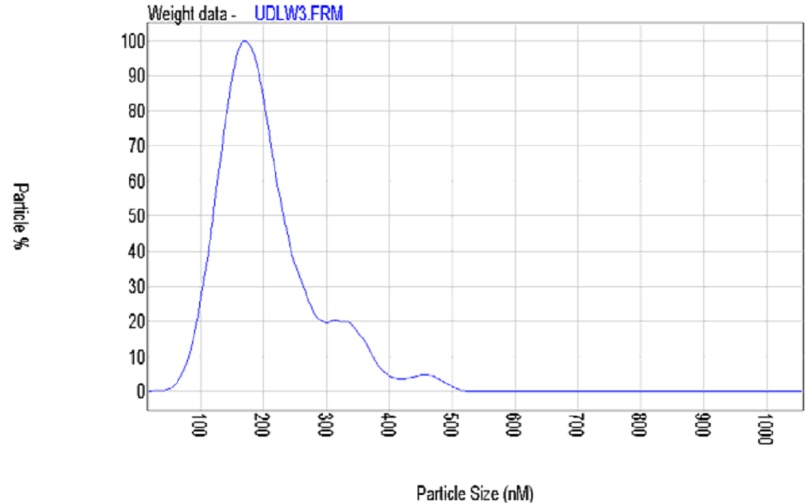
Figure 12. On-line CHDF PSD data for PVA latex from a batch reactor.
图12- 聚乙烯醇乳胶在一批反应器在线CHDF PSD检测器输出数据
Conclusions:
结论:
CHDF particle size fractionation can be used for high-resolution particle size analysis of dispersions in the particle size range of 2 nm to 5 microns. A process on-line particle sizer has been implemented based on CHDF fractionation. This on-line device is capable of performing automatic sample dilution, and interfacing with a Honeywell Plant Control system.
毛细管流体分离(CHDF)粒度分离技术可用于2nm ~ 5μm范围内的分散体的高分辨率粒度分析。在毛细管流体分离(CHDF)的基础上,实现了一种工艺在线粒度仪。该在线装置能够自动稀释样品,并与霍尼韦尔工厂控制系统接口。
Acknowledgements:
致谢:
The author would like to thank Dr. Tim Crowley for sharing some of the CHDF on-line data presented here.
作者要感谢Tim Crowley博士与我们分享CHDF在线数据。
References:
参考文献:
1. Barth, H. G., and Flippen, R. B., Anal. Chem., 67, 257R-272R, 1995.
2. Weiner, B. B., and Tscharnuter, W. W., in Particle Size Distribution: Assessment and Characterization, ACS Symp. Series 332, p. 48, 1987.
3. Silebi, C. A., and DosRamos, J. G., AIChE J., 35, 165, 1989.
4. DosRamos, J. G., Ph.D. Dissertation, Lehigh U., 1988.
5. www.matec。。com/www.yh-tek。。com
6. DosRamos, J. G., and Silebi, C. A., J. Coll. Int. Sci., 135, 1, 1990.
7. Venkatesan, J., DosRamos, J. G., and Silebi, C. A., in Particle Size Distribution II: Assessment and Characterization, ACS Symp. Series 472, p. 279, 1991.
8. DosRamos, J. G., in Particle Size Distribution III: Assessment and Characterization, ACS Symp. Series 693, p. 207, 1998.
9. Silebi, C. A., Ph.D. Dissertation, Lehigh U., 1977.
10. Bohren, C., and Huffman, D. R., Absorption and Scattering of Light by Small Particles, Wiley Interscience Publication, 1983.
11. DosRamos, J. G., and Silebi, C. A., Polym. Int., 30, 445, 1993.
12. Venkatesan, J., and Silebi, C. A., in Particle Size Distribution III: Assessment and Characterization, ACS Symp. Series 693, p. 266, 1998.
13. Dr. Tim Crowley, U. Delaware, direct communication.
日本药典6.08对滴眼液的不溶性颗粒检测规范 滴眼液不溶性微粒检测是检查滴眼液中不溶性颗粒物的大小
流式动态图像法粒度仪激光粒度仪助力蛋白质抗体类药物颗粒检测 人
ARAMUS™ 一次性冻存袋的颗粒检测时间:2023-3-23 阅读:16引言 一次性使用
本标准介绍了欧洲药典中注射液颗粒检测方法和检测指标.对于出口到欧盟的客户并需要做颗粒检测的,有很好的参考价值
PLDMC近日发布油液颗粒检测整体解决方案,旨在解决工业润滑管理中油液的颗粒污染物清洁度水分粘度机械杂质等项
在线微纳米液体颗粒检测传感器可以对对清洗剂、半导体、超纯水、电子产品、手机玻璃、平板玻璃、硅晶片、经济型滤油
帕纳科是X射线荧光光谱分析仪器及软件的主要供应商之一分析仪器主要应用于科学的研究和发展工业过程控制以及半导体
天津市拓普仪器有限公司原天津市光学仪器厂,是国家定点生产制造物理分光仪器的ZD企业公司现位于天津市南开区高新
天津市拓普仪器有限公司原天津市光学仪器厂,是国家定点生产制造物理分光仪器的ZD企业公司现位于天津市南开区高新

沪公网安备 31011502008050号